Approval Ratings
Evolution of Biden’s approval ratings since he came to office.
Plotting the data
We have imported the data on Biden’s approval from fivethirtyeight and now start by calculating a confidence interval on his approval ratings.
approval_polllist$enddate<-mdy(approval_polllist$enddate)
approval_plot<-approval_polllist%>%
filter(subgroup=="Voters")%>% #limit the data to group "Voters" in order to recreate the graph
select(enddate,pollster,samplesize,weight,approve, disapprove)%>%
mutate(week_poll=week(enddate),mg_approval=approve-disapprove) #obtain the week of the enddate, to plot it against average approval
approval_biden<-approval_plot%>%
group_by(week_poll)%>%
summarise(margin_apr_mean=mean(mg_approval),
sd_margin=sd(mg_approval),
count_pollster=n(),
t_critical = qt(0.975,count_pollster-1), #calculate t critical, for 95% confidence (2.5% per side)
se_margin=sd_margin/sqrt(count_pollster),
lower_interval=margin_apr_mean-t_critical*se_margin,
higher_interval=margin_apr_mean+t_critical*se_margin, #calculate confidence interval
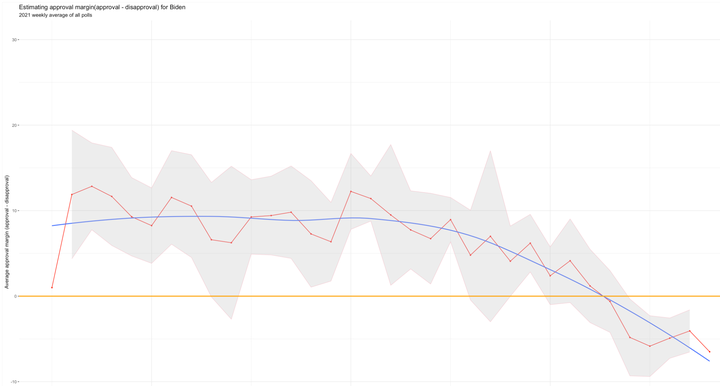
)## Warning in qt(0.975, count_pollster - 1): NaNs producedLet’s now actually plot the data. The confidence interval is shaded in grey, and the blue line represents a smoothing average across the data points.
approval_plot1<-ggplot(approval_biden,aes(x=week_poll))+
  geom_line(aes(y=margin_apr_mean),color="red",size=0.5)+
  geom_point(aes(y=margin_apr_mean),color="red",size=0.8)+
  geom_smooth(aes(y=margin_apr_mean),se=FALSE,size=0.8)+
  geom_line(aes(y=lower_interval),color="pink",size=0.3)+
  geom_line(aes(y=higher_interval),color="pink",size=0.3)+
  geom_ribbon(aes(ymin=higher_interval,ymax=lower_interval),fill="grey",alpha=0.3)+
  geom_hline(yintercept =0,color="orange",size=1)+

  labs(x="Week of the year",y="Average approval margin (approval - disapproval)",
       title = "Estimating approval margin(approval - disapproval) for Biden",
       subtitle = "2021 weekly average of all polls")+

  theme_bw()+
  theme(plot.background = element_rect(fill = NA , colour = 'grey',size=0.1))+
  theme(panel.border = element_rect(colour = NA, fill=NA))+
  ylim(-15,30)

approval_plot1
## `geom_smooth()` using method = 'loess' and formula 'y ~ x'## Warning: Removed 2 row(s) containing missing values (geom_path).
## Warning: Removed 2 row(s) containing missing values (geom_path).
Maximilian Stock
Masters Candidate at London Business School
I am currently trying to better understand Machine Learning. Also, I am passionate about the world of sports.